

Understanding where K9 teams are being deployed can provide valuable insight into your department’s operations. With PACKTRACK’s new Deployment Heatmap, supervisors can now visualize their handlers’ activity on an interactive map—making it easier to spot patterns, understand coverage, and see where K9 resources are being used. The new heatmap is currently available to supervisors on the website and in the mobile app.
See Your K9 Team’s Activity on a Map
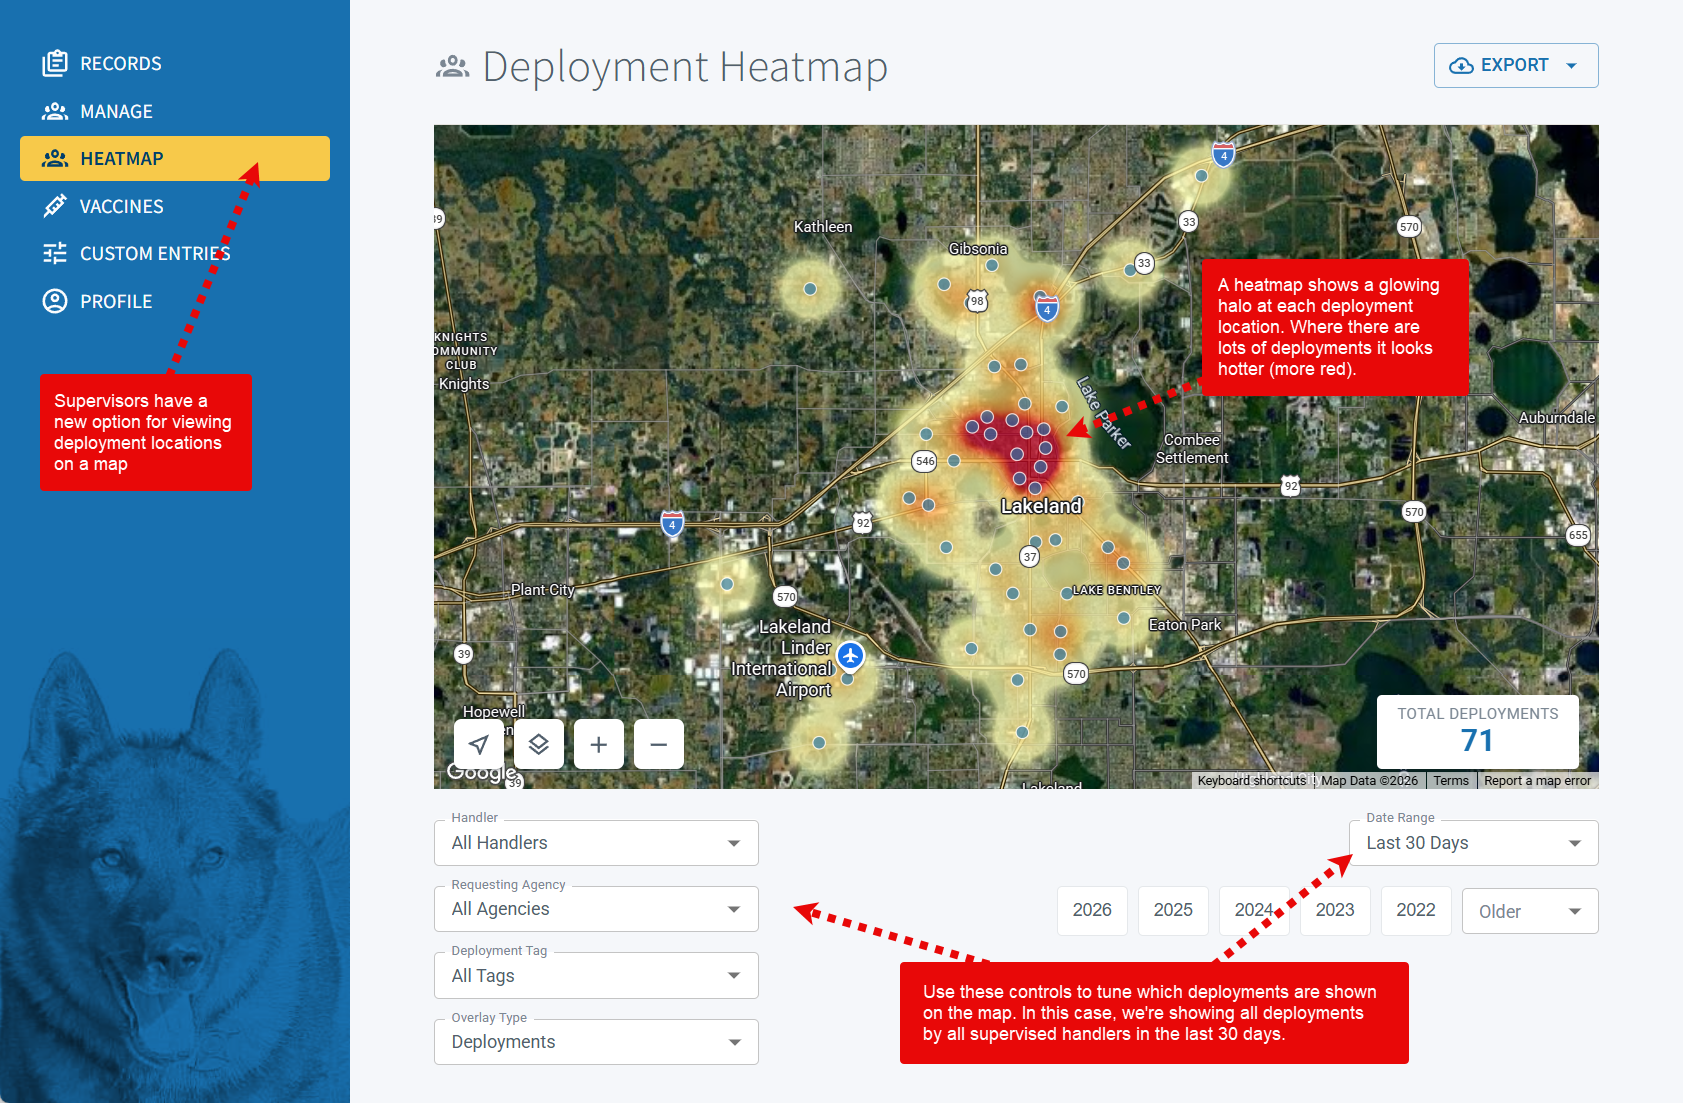
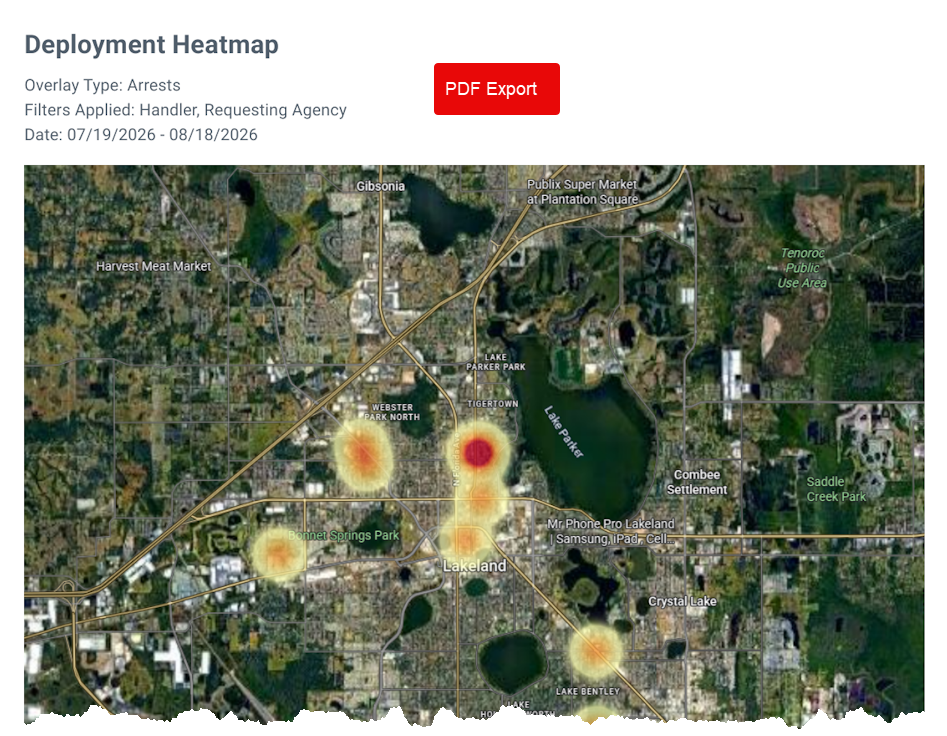
The Deployment Heatmap gives supervisors a geographic view of the records submitted by the handlers they supervise. Instead of looking at deployment records one at a time, the heatmap lets you see where activity is concentrated across your area. Each deployment is represented by a location on the map, with areas containing more activity appearing “hotter” as more locations overlap.
This can be useful for understanding things like:
- Where your K9 teams are being deployed most frequently
- Which areas are generating the most K9 activity
- Where arrests, bites, or other types of K9 activity are occurring
- How your team’s activity is distributed across your jurisdiction
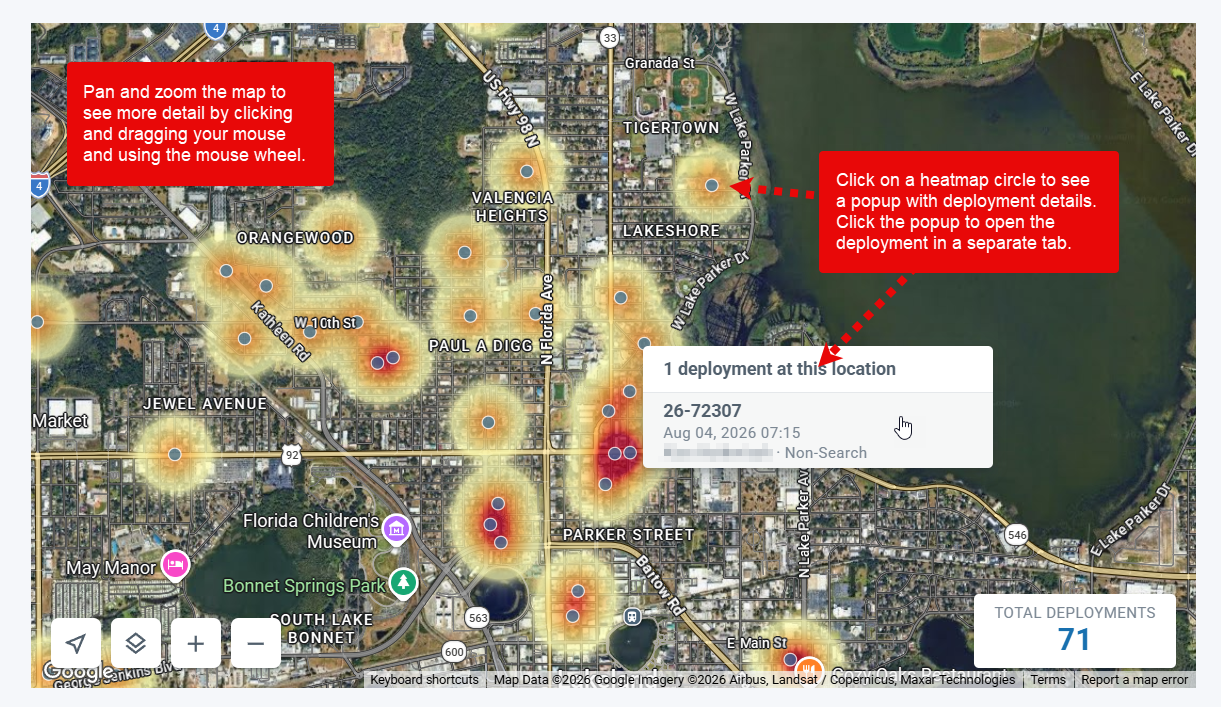
The map is fully interactive, so you can pan and zoom to focus on a particular area and select different map layers to get the level of detail you need.
Filter the Activity You Want to See
The heatmap becomes especially useful when you narrow the information down to exactly what you want to analyze. Filters at the bottom of the map allow you to select:
- Handler – View activity for all supervised handlers or a specific handler.
- Requesting Agency – See deployments requested by a particular agency.
- Deployment Tag – Focus on deployments associated with a particular tag.
- Date Range – Choose a predefined date range or select a specific year.
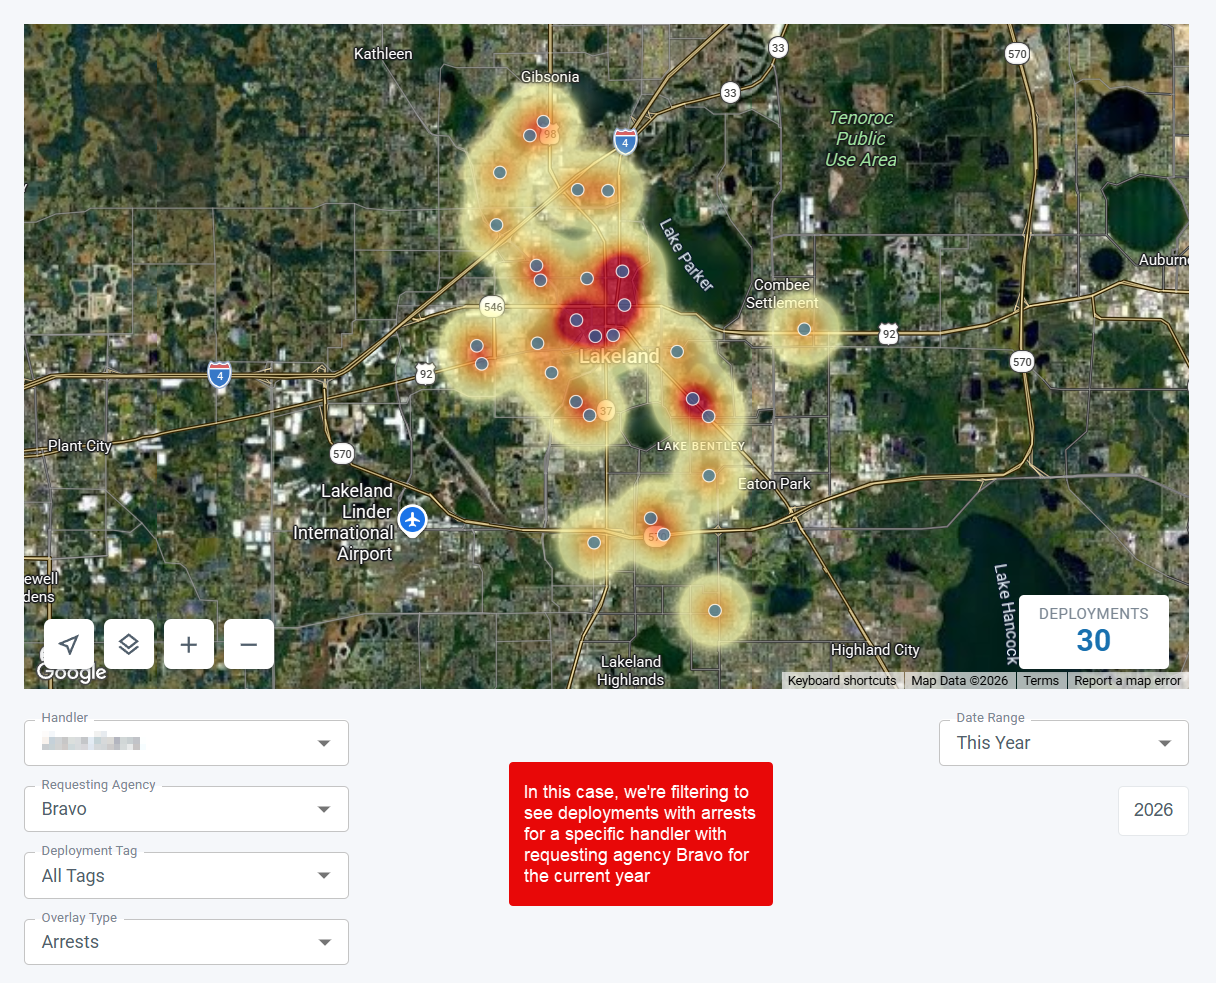
You can also change the Overlay Type to visualize different kinds of K9 activity, including:
- Deployments
- Arrests
- K9 bites
- People found
- Detection work
- Patrol work
For example, you could filter the map to show all deployments by one handler, requested by a particular agency, during the current year. Or you could look at all supervised handlers over the last 30 days to get a quick picture of recent activity.
Take the Heatmap With You
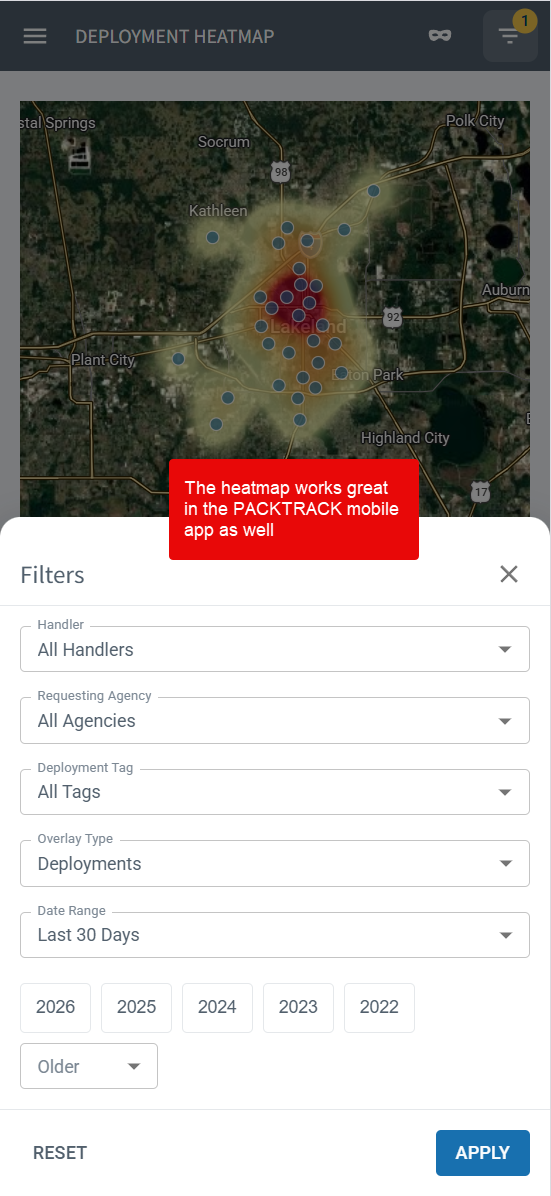
The Deployment Heatmap isn’t limited to a computer. Supervisors can also access the heatmap directly from the PACKTRACK mobile app, making it easy to review K9 activity while away from the desk. The mobile experience provides the same interactive map, allowing you to explore deployment locations, zoom in on areas of interest, and tap locations to view deployment details right from your phone.
Explore Individual Deployments
The heatmap isn’t just a visual overview. You can also use it to get to the underlying deployment records. Click on a location on the map to see a popup containing details about the deployment at that location. From there, you can click the popup to open the full deployment record in a separate tab.
This makes it easy to go from “Where is our activity happening?” to “What happened on that deployment?”
Export Your Map
Once you’ve filtered the heatmap and adjusted the map to show exactly what you need, you can export it for use outside of PACKTRACK. The export option lets you save the current map view as either a PNG image or PDF. This can be useful when you need to include a map in a report, presentation, briefing, or other documentation.
A Note About Deployment Locations
The heatmap relies on the address recorded on each deployment to determine its location on the map. If a deployment has an address that PACKTRACK cannot successfully convert into geographic coordinates, that deployment may not appear on the heatmap. The deployment record itself is not affected—it simply cannot be plotted on the map.
For the best results, make sure deployment locations are entered as accurately and completely as possible.
Built for Supervisors
The Deployment Heatmap is currently available only to supervisors. It gives supervisors a new way to look beyond individual records and understand the broader operational picture across the handlers they supervise.
Whether you’re reviewing recent activity, looking for geographic patterns, preparing a report, or simply trying to better understand how your K9 resources are being utilized, the heatmap provides another valuable perspective on your PACKTRACK data.
We’re excited to see how departments use this new capability and would love to hear your feedback. Are you a K9 handler? We’d also like to know if you would find a heatmap of your own deployment records useful in PACKTRACK? Let us know what you’d like to see in future versions of the feature.