The PACKTRACK Deployment Summary report just got more insightful. A new table now highlights exactly when your K9 teams are being deployed using a visual breakdown of activity by day of the week and hour of the day. This gives you a clear, at-a-glance view of peak deployment times – making it easier than ever to spot patterns, optimize staffing, and share key activity insights with leadership. The goal is to help you make smarter, data-driven decisions to get even more value from the records you keep.
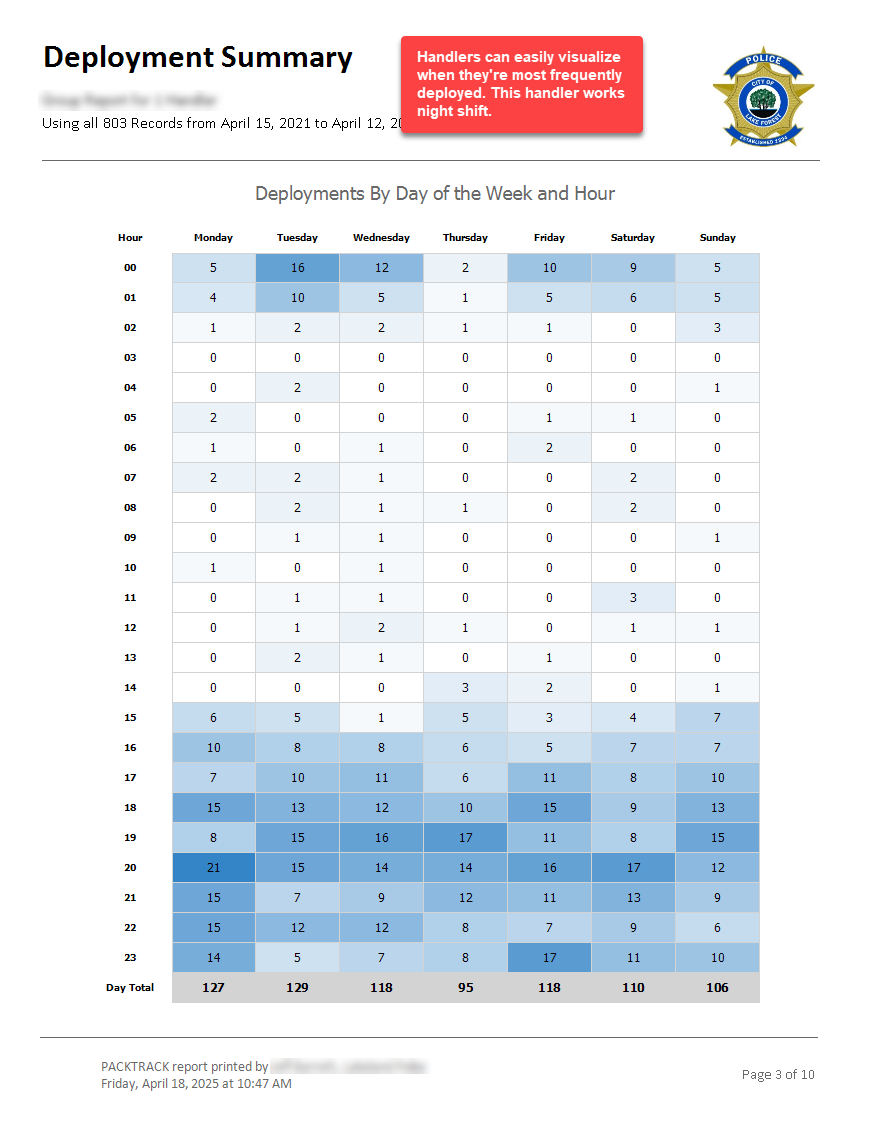
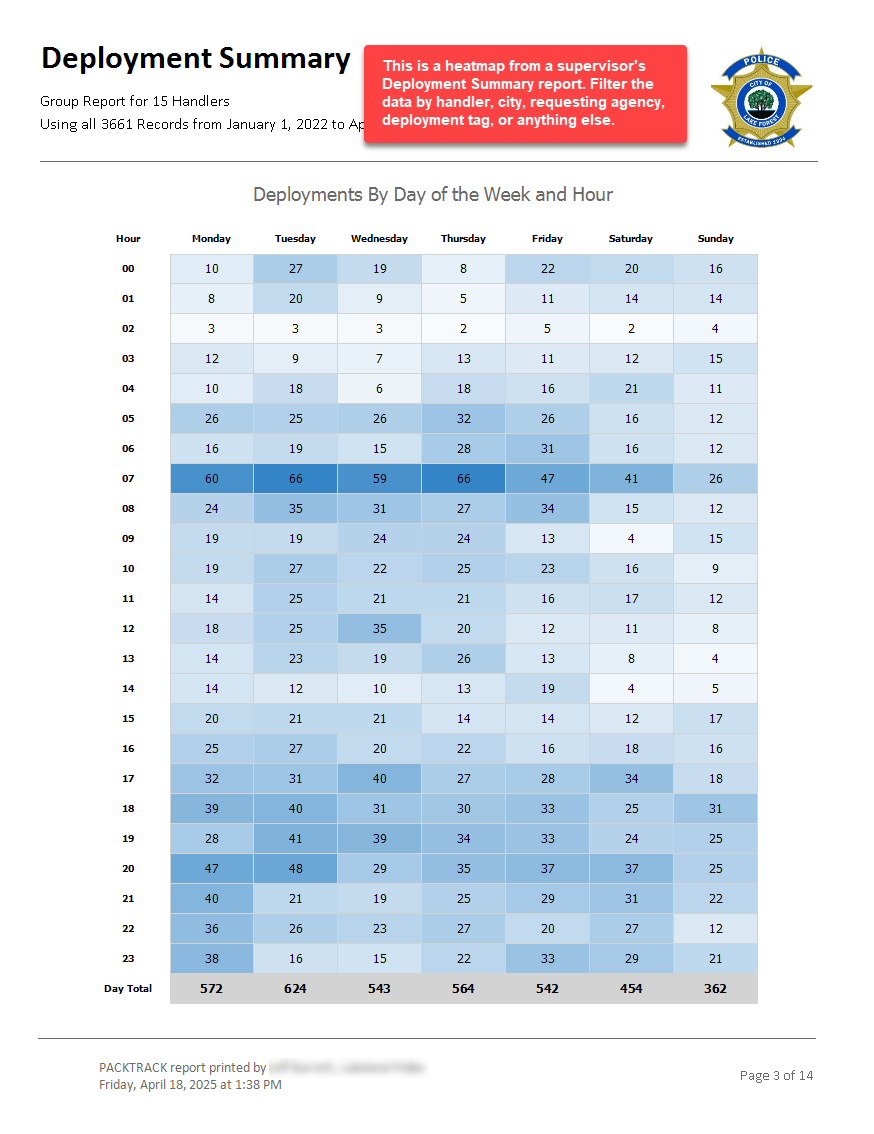
The Deployment Summary report is available for handlers and supervisors and provides great flexibility. It’s easy to filter by dog, date range, deployment type, and more – so you can get the insights you need. For example, as a handler you may want to know when you’re most frequently deployed for K9 tracking work. Simply filter your records for tracking deployments, hit the Report button and then select the Deployment Summary report. As a supervisor, you could be interested in when handlers are most frequently deployed for a specific requesting agency. To do this, filter your records by the desired requesting agency and then run the Deployment Summary report.
This feature is now live for all handlers and supervisors. Run a Deployment Summary report and check out the new heatmap chart. We’d love to hear what you think.